Adding WMS Layers (Web Map Services)

Web Map Services (WMS) are publicly available geospatial datasets that comply to an open protocol, allowing many different types of applications to consume them. Examples of these services can be found on the 
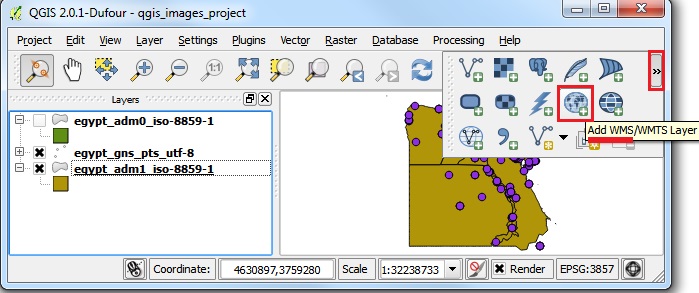
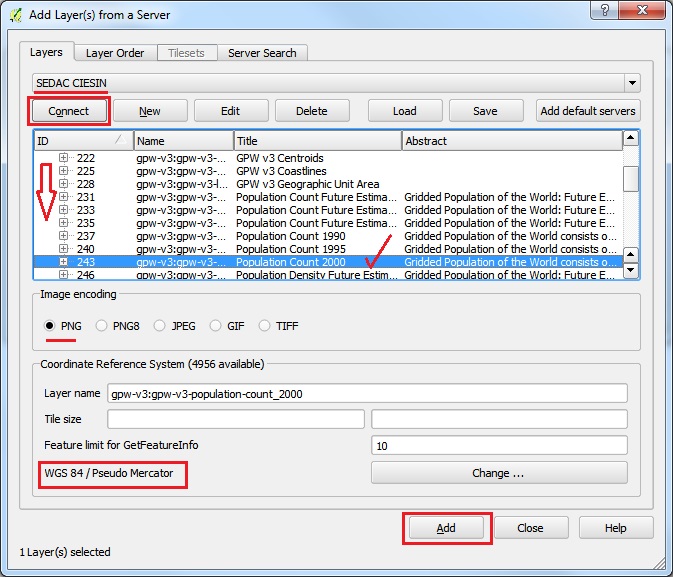
OpenLayers Wiki. One great thing about QGIS 2.0 is that adding WMS and WMTS (time enabled WMS) data layers has been simplified to clicking on a single Add Data button! Just go to the Manage Layers Toolbar, and click on the double angle bracket >> to show all the options, then click on the ADD WMS / WMTS button

  1. Click on Server Search tab.
  2. Enter a search term, such as "population density" into the form, and click SEARCH
  3. From the list of WMS Layer Titles found, pick a service to add to your connection list, for example: Gridden Population of the World, from the CIESIN/SEDAC datasets.
  4. Click ADD SELECTED ROW TO WMS LIST, which will add the connection parameters to your QGIS WMS pick list (but won't connect yet!)

  1. Now we can try to actually connect to the CIESIN/SEDAC server
  2. On the Add Layers from Server window, make sure you have set the target layer to Gridded Population of the World, using the drop-down menu if needed.
  3. Click on CONNECT to verify the service availability
  4. It is quite common to get errors! As live web services, WMS might not be available at the time of connection. In addition, due to configuration testing or changes of the server itself, the URLs might have to be updated occasionally.

  1. Let's check to see if we can find an updated URL for the CIESIN/SEDAC server (which is a federally funded clearinghouse for GIS data, so it should be fairly stable over the long term).
  2. A Google search for the title of the service "Gridded Population of the World, version 3 (GPWv3) WMS service." turned up this URL for Web Services | SEDAC
  3. On the SEDAC Web Services page, look for the Population Density Grid v3 WMS Page
  4. On that WMS description page you will see the OpenLayers example has the CURRENT WMS URL: http://sedac.ciesin.columbia.edu/geoserver/wms
  5. Now let's check to see what our QGIS connection is looking for. On the Add Layers from Server window, set the WMS target layer to Gridded Population of the World, then click EDIT
  6. Change the URL setting to the correct URL: http://sedac.ciesin.columbia.edu/geoserver/wms and hit OK

  1. Now set the target service to SEDAC CIESIN and click CONNECT
  2. If the service is available, you will see a long list of WMS services being provided by SEDAC
  3. Scroll Down until you find the layer called "gpw-v3 Population count 2000" and click on it
  4. You can change the image type or Projection settings if needed, then click ADD
  5. Click CLOSE to return to your QGIS Map Browser, where you should now see the global population WMS layer.

  1. Because you are establishing a remote connection with a web service, the layer might take a moment to be added.
  2. Close the connection window and check your Layer List to see if the "Population Count" layer has been added.
  3. If the layer appears to have been added but is not visible in the Map View, right-click on the WMS layer in the Layer List, and go to PROPERTIES, then the STYLE tab
  4. The Render Type might be detected as Singleband Color, and the Grayscale set to OFF
  5. Change the Grayscale setting to By Average, then click OK

  1. Your Gridded Population WMS should now be visible and function as a typical raster layer.
  2. Keep in mind that if you add many WMS layers to your QGIS project you might have delays or crashes due to the connections. You can always set them up and simply UNCHECK them in the layer list (which prevents them from rendering), until you really need them.

  1. To explore the Gridded Population in Egypt, we can zoom into egypt_adm0 layer and right-click to set Properties > Style > Fill > Fill Style = NO BRUSH and change the BORDER COLOR to red
  2. Then we can right-click on the egypt_gns_pts layer to set Properties > Simple Marker > Size = 0.2 and set the LAYER TRANSPARENCY to 50%.
  3. Now the Gridded Population grayscale should reveal the distinct clustering of population along the Nile and in the Nile River Delta.

    This also shows that even though there is a higher density of NAMED POINT FEATURES in the Northeast part of Egypt, those features do not necessarily correlate to human population.

See also IMPORT from GoogleMaps KML tutorial.