Point in Polygon Query
To find out how many points in a particular layer occur in polygons of a second layer, use this method.
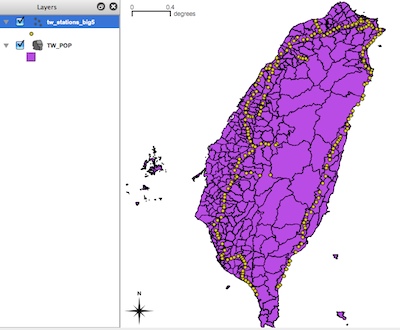
Points Layer
- For this exercise, we'll use the points showing railway stations in Taiwan, and the polygons for county level units in Taiwan.
- Our goal is to (a) calculate the number of railways station points in each county unit, and (b) create a thematic map of the results
- In QGIS, Add Vector Data, set UTF8 encoding, and browse to part_three/tw_stations.shp
- Add Vector Data, set BIG5 encoding, and browse to china/TW_POP.shp You should have two layers in your QGIS project:
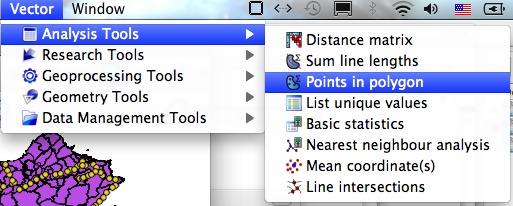
- From the main QGIS menu, go to Vector | Analysis Tools | Points in Polygon
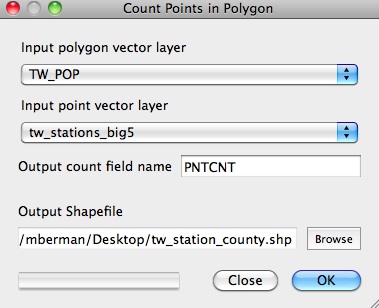
- In the dialog, make sure that the Input Polygon Vector Layer = TW_POP
- Then make sure that the Input Point Vector Layer = tw_stations
- You may change the "output count field name" or accept the default: PNTCNT
- For output shapefile, browse to the folder you want to save the new layer, and enter the output filename, here, we have typed "tw_station_county" as the output file.
- When you have completed the dialog, click OK
Checking and symbolizing results
- You will be prompted to open the new layer in the TOC, click YES
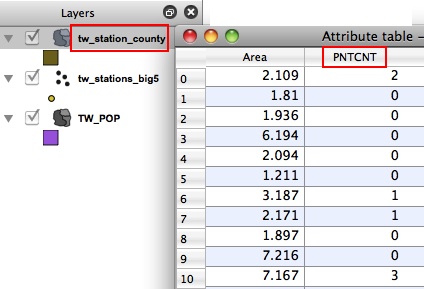
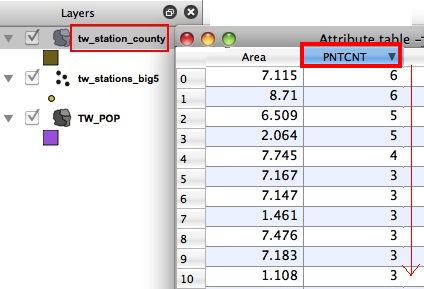
- Right click on the new layer (tw_station_county) and open the attribute table
- Scroll all the way to the right of the table to make sure the PNTCNT field was created
- Click on the field name cell, PNTCNT, to sort the resulting count of stations in Ascending or Descending order
- Now we can see that the highest number of stations in a single county was 6
- Close the attribute table, and right click on the layer to open the layer Properties
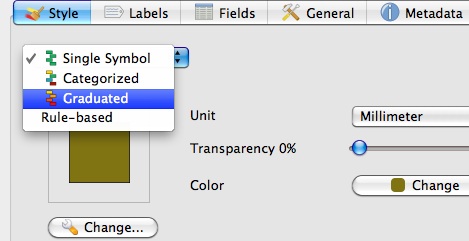
- Click on the STYLE tab to view the symbolization options
- On the upper left, change the Single Symbol drop-down option to GRADUATED.
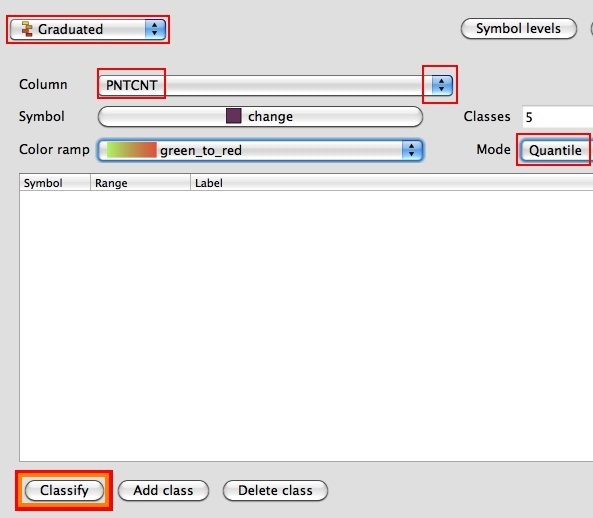
- In the Graduated dialog, change the COLUMN drop-down selection to PNTCNT
- Change the MODE setting to QUANTILE, choose a color ramp, such as GREEN TO RED
- Most importantly, you must click CLASSIFY at the lower left, or QGIS will not run the classification process!
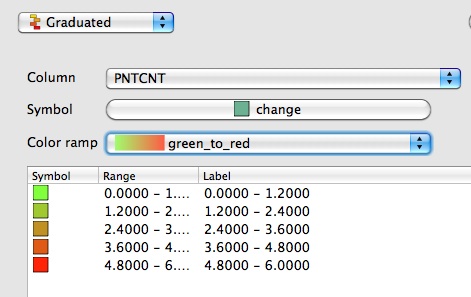
- After Clicking CLASSIFY, you should see the graduated symbols ramp
- You may customize your classification scheme in the Symbol, Range, and Label grid.
- For our purposes, we will accept the default scheme and click OK in the lower right.
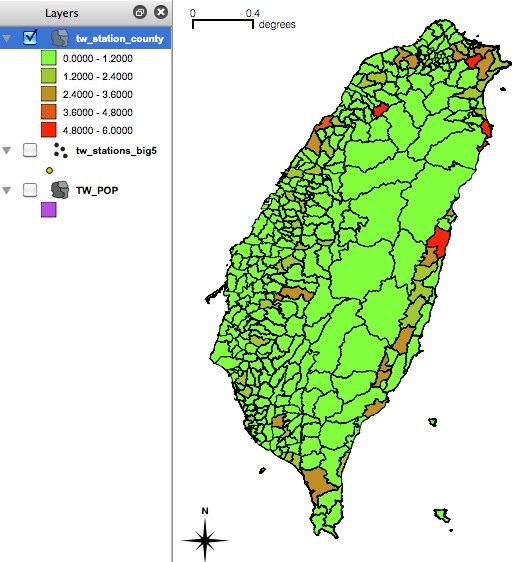
- Our thematic map shows the concentration of railway stations in each county.
|
