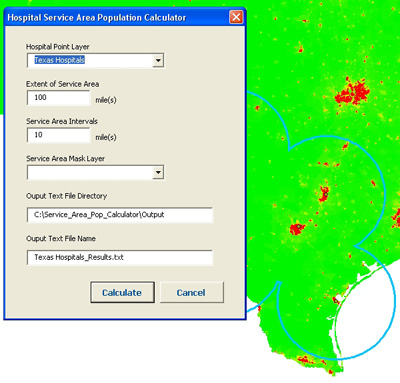
The CGA developed an ArcObjects application that allows researchers to estimate population within a specified radii around certain points, using a raster dataset of population density.
no links
Files:
pop_calculator1.jpg
The CGA developed an ArcObjects application that allows researchers to estimate population within a specified radii around certain points, using a raster dataset of population density.
no links
Files:
pop_calculator1.jpg
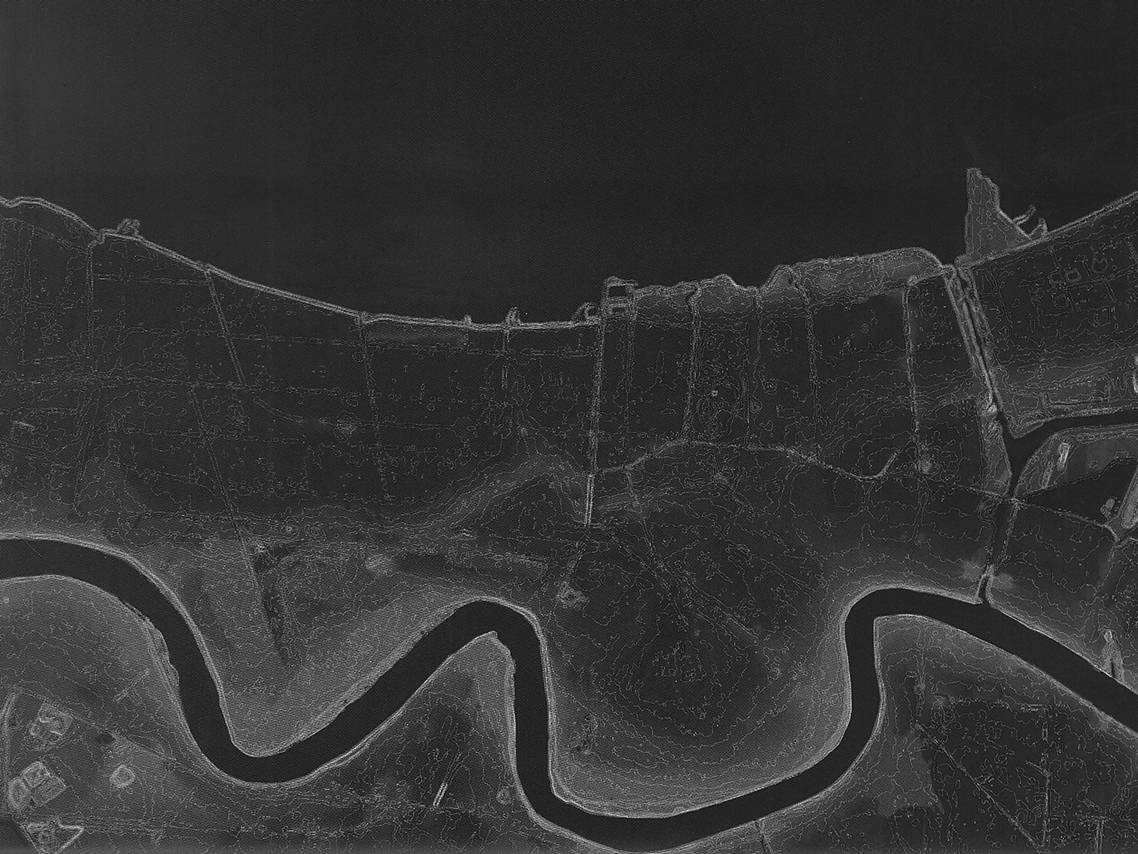
This project calculated average water depth by zip code zone for New Orleans right after Katrina.
Input data set was a table of LiDAR points with geographic coordinates and water depths. The technical challenge was the number of points to process - more than 26 million points for 37 zip code zones in 535 square miles.
The normal spatial statistics method would fail due to prolonged computing time. The work-around was to break the points by zones and calculate statistics per zone.
no links
Files:
neworleans_11.jpg
This project assisted the development of maps for a book manuscript: “The Common Pot”, using GIS to map historical sites and waterways associated with Native American nations in the northeast.
no links
Files:
commonpot_11_resized.gif
For support of the course “Doing Business in China in the Early 21st Century” the CGA created maps to show economic development in the different regions of China.
no links
Files:
chinagdp_111.gif
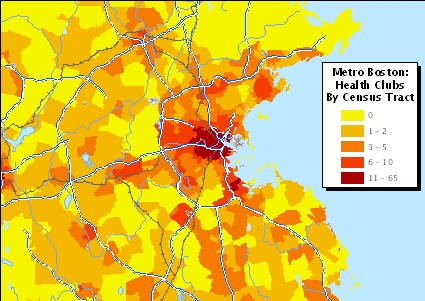
The CGA developed summary data for a public health study investigating access to businesses that may impact obesity rates.
An ArcObjects procedure was developed to parse twenty categories of businesses by SIC codes from a nationwide business location file.
A second procedure counted the number of businesses by category for each Census Tract.
The resulting GIS database can be used for analysis and mapping.
no links
Files:
boston_health_clubs1.jpg
The ROAD data includes election returns, socioeconomic summaries, and demographic measures of the American public. It includes every election at and above State House, along with party registration and other variables, in each state for the roughly 170,000 precincts nationwide. The geographic unit of ROAD is based on the Census Bureau defined Minor Civil Divisions (MCD).
There are 47,173 MCDs, completely tile the U.S. land mass. For each MCD, the ROAD collection provides all electoral data aggregated from the precinct level (roughly 30-40 variables), as well as 3,725 variables from the U.S. Census long form. This is the smallest level of aggregation at which publicly-available census data and electoral data can be made to coincide.
no links
Files:
road_5_01.gif
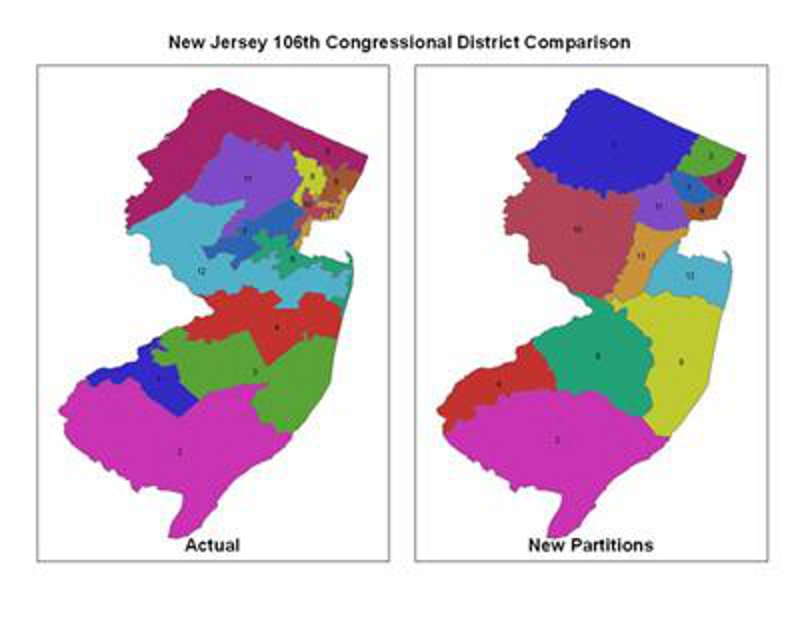
The CGA created maps of actual and hypothetical congressional districts for comparison. The maps of actual districts use the 106th Congressional District Boundaries obtained from the U.S. Census Bureau. The maps of hypothetical congressional districts are generated from lists of coordinate pairs provided by the researchers. Each coordinate pair is intended to represent a Census Block Group centroid.
A procedure was written to automate the process of parsing the text files containing the hypothetical redistricting points, plotting the points as ArcGIS shapefiles and subsequently generating thiessen polygon shapefiles. The process also attributed the thiessen polygons with their associated district assignment and generate district layers for map making.
no links