by Devika Kakkar
For a recent project, we used Space Time Cube (STC) in ArcGIS Pro to analyze the distribution of air pollutants over space and time for a particular area. This blog documents the procedure as well as the capabilities and limitations of using STC in ArcGIS Pro.
The Dell PC used for the project is a 64-bit Windows 7 Professional SP1 operating system machine with i7-6700 CPU @ 3.40GHz × 2 and 64 GB of RAM. The graphic card on the machine is Intel® HD Graphics 350 with 1824 MB of total memory.
The dataset consists of a 32MB shapefile containing 26,560 observations measuring the values of various air pollutants for a specific region. The dataset spans an area of 206 kilometer east to west and 132 kilometer north to south collected over a period 30 days. Please note that the original data comes with elevation of observation points, however the STC tool cannot consider elevation variations. It uses the Z dimension to represent time, the “higher” the cube location, the later in the Time dimension the observations were made. The value of each cube is a statistical summary (mean in our case) of all observations made within the spatial resolution range, regardless of the actual elevation of the data points.
The step-by-step procedure to create and visualize a STC using ArcGIS Pro version 1.1 is available in the video below:
https://www.youtube.com/watch?v=SIf6zcJmMqw&feature=youtu.be&a
Different combinations of space and time scales were tested to find the crashing threshold in order to get a sense of the capacity of the ArcGIS Pro’s STC. The following table documents the characteristics as well as the creation and visualization time for each STC.
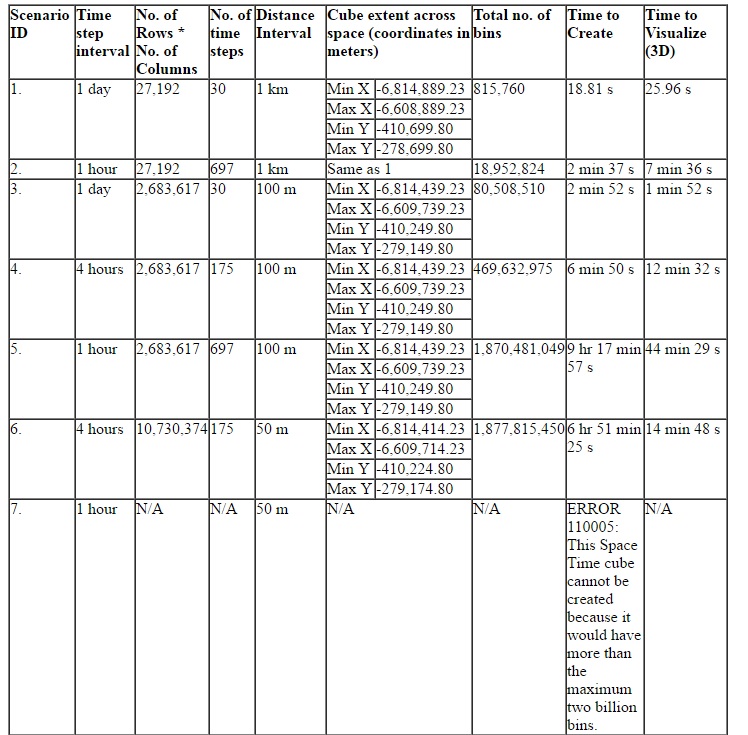
As it can be seen from the table above that STC with the resolution of 1hr/50m cannot be created because it would have close to four billion bins while the maximum limit is two billion bins only. The two billion limit comes from the record limit in a file geodatabase, please see the link below in order to learn more:
In addition, 26,560 observations spread across 4 billion bins would result in an extremely sparse cube. As you get more and more sparse, each feature will have fewer and fewer neighbors and this will affect the calculations for the statistic.
It was observed that during the creation of STC with resolution of 4hr/100m, the CPU usage for ArcGIS Pro was up to 13% while the memory usage was up to 31% whereas during visualization of the same cube the CPU usage was up to 13% and the memory usage was up to 20%.
From the above discussion, it could be seen that is important to find a proper resolution for the STC based on the following:
Objective of the project
Size of the dataset/ No. of observations
Spatial and Temporal extent of the dataset
PC configurations
Further, the following points should be kept in mind while working with STC in ArcGIS Pro:
Creation of STC requires projected data to accurately measure distances
The field containing the event timestamp must be of type Date
Before Visualization of the STC, one must set the elevation surface to zero
The time it takes to render the cube in three dimensions may vary considerably based on the number of features and the graphics card associated with your CPU
If some or all of your data is not drawing, it may fall outside of the Visibility Range limits, which can be cleared. If some or all of your data is underground, you may need to turn off Elevation Surfaces
STC is a very useful tool for analyzing data distributions and patterns in the context of both space and time. This blog can be used as a reference when working with STC, particularly in the case of large datasets.
no links
no file attachments