Airbus Imagery Request

Airbus Defence and Space has granted Harvard University up to $30,000 in free satellite imagery, a program the CGA will manage.  For each imagery dataset granted, the Harvard researcher will provide a description on how the imagery was used and how it was useful.

To set up an appointment to browse and request available imagery, fill out our Request Form, and under the Request Access field, choose “Airbus Image”.

no links

no file attachments

Share

Political Geography GIS Workshop

Introduction to GIS lecture and lab for Gov. 2525 Political Geography Class.  Two 2 hour sessions taught in consecutive weeks.  Objectives of the exercise:

  • To gain a basic level of familiarity with ArcGIS software.
  • To understand how to display and query GIS shapefile data.
  • To make choropleth, dot density, and proportional symbol maps.
  • To perform a table join, spatial join, map latitude / longitude coordinates, perform an aggregation, and create density maps.

Download the lab materials.

no links

no file attachments

Share

Introduction to GIS for Integrated Sustainable Design and Planning

Guest lecture and mapping exercise given to  students in Harvard Extension School course E119 “Integrated Sustainable Design and Planning: from Buildings to Communities”.  October 10, 2017.

Download the slides.

Download the mapping exercise.

no links

no file attachments

Share

October 2017

CGA Newsletter October 2017 PDF (Download)


CGA NEWS

GIS INSTITUTE Applications

Please note the deadline for submitting applications to attend the CGA GIS Institute Winter 2018 is October 20th, 2017.

More info about the GIS Institute is available here.
Or proceed directly to the Application Page.


CGA’s Monthly GIS Presentations - come join the discussion

Geography Colloquium
“Data-Driven Urban Sustainability: Challenges and Opportunities”, presented by Shan Jiang (MIT). Thursday, October 5th, 2017. 12:00pm-1:30pm. Room S354, CGIS South building, 1730 Cambridge St., Cambridge, MA.

ABCD-GIS Presentation Series
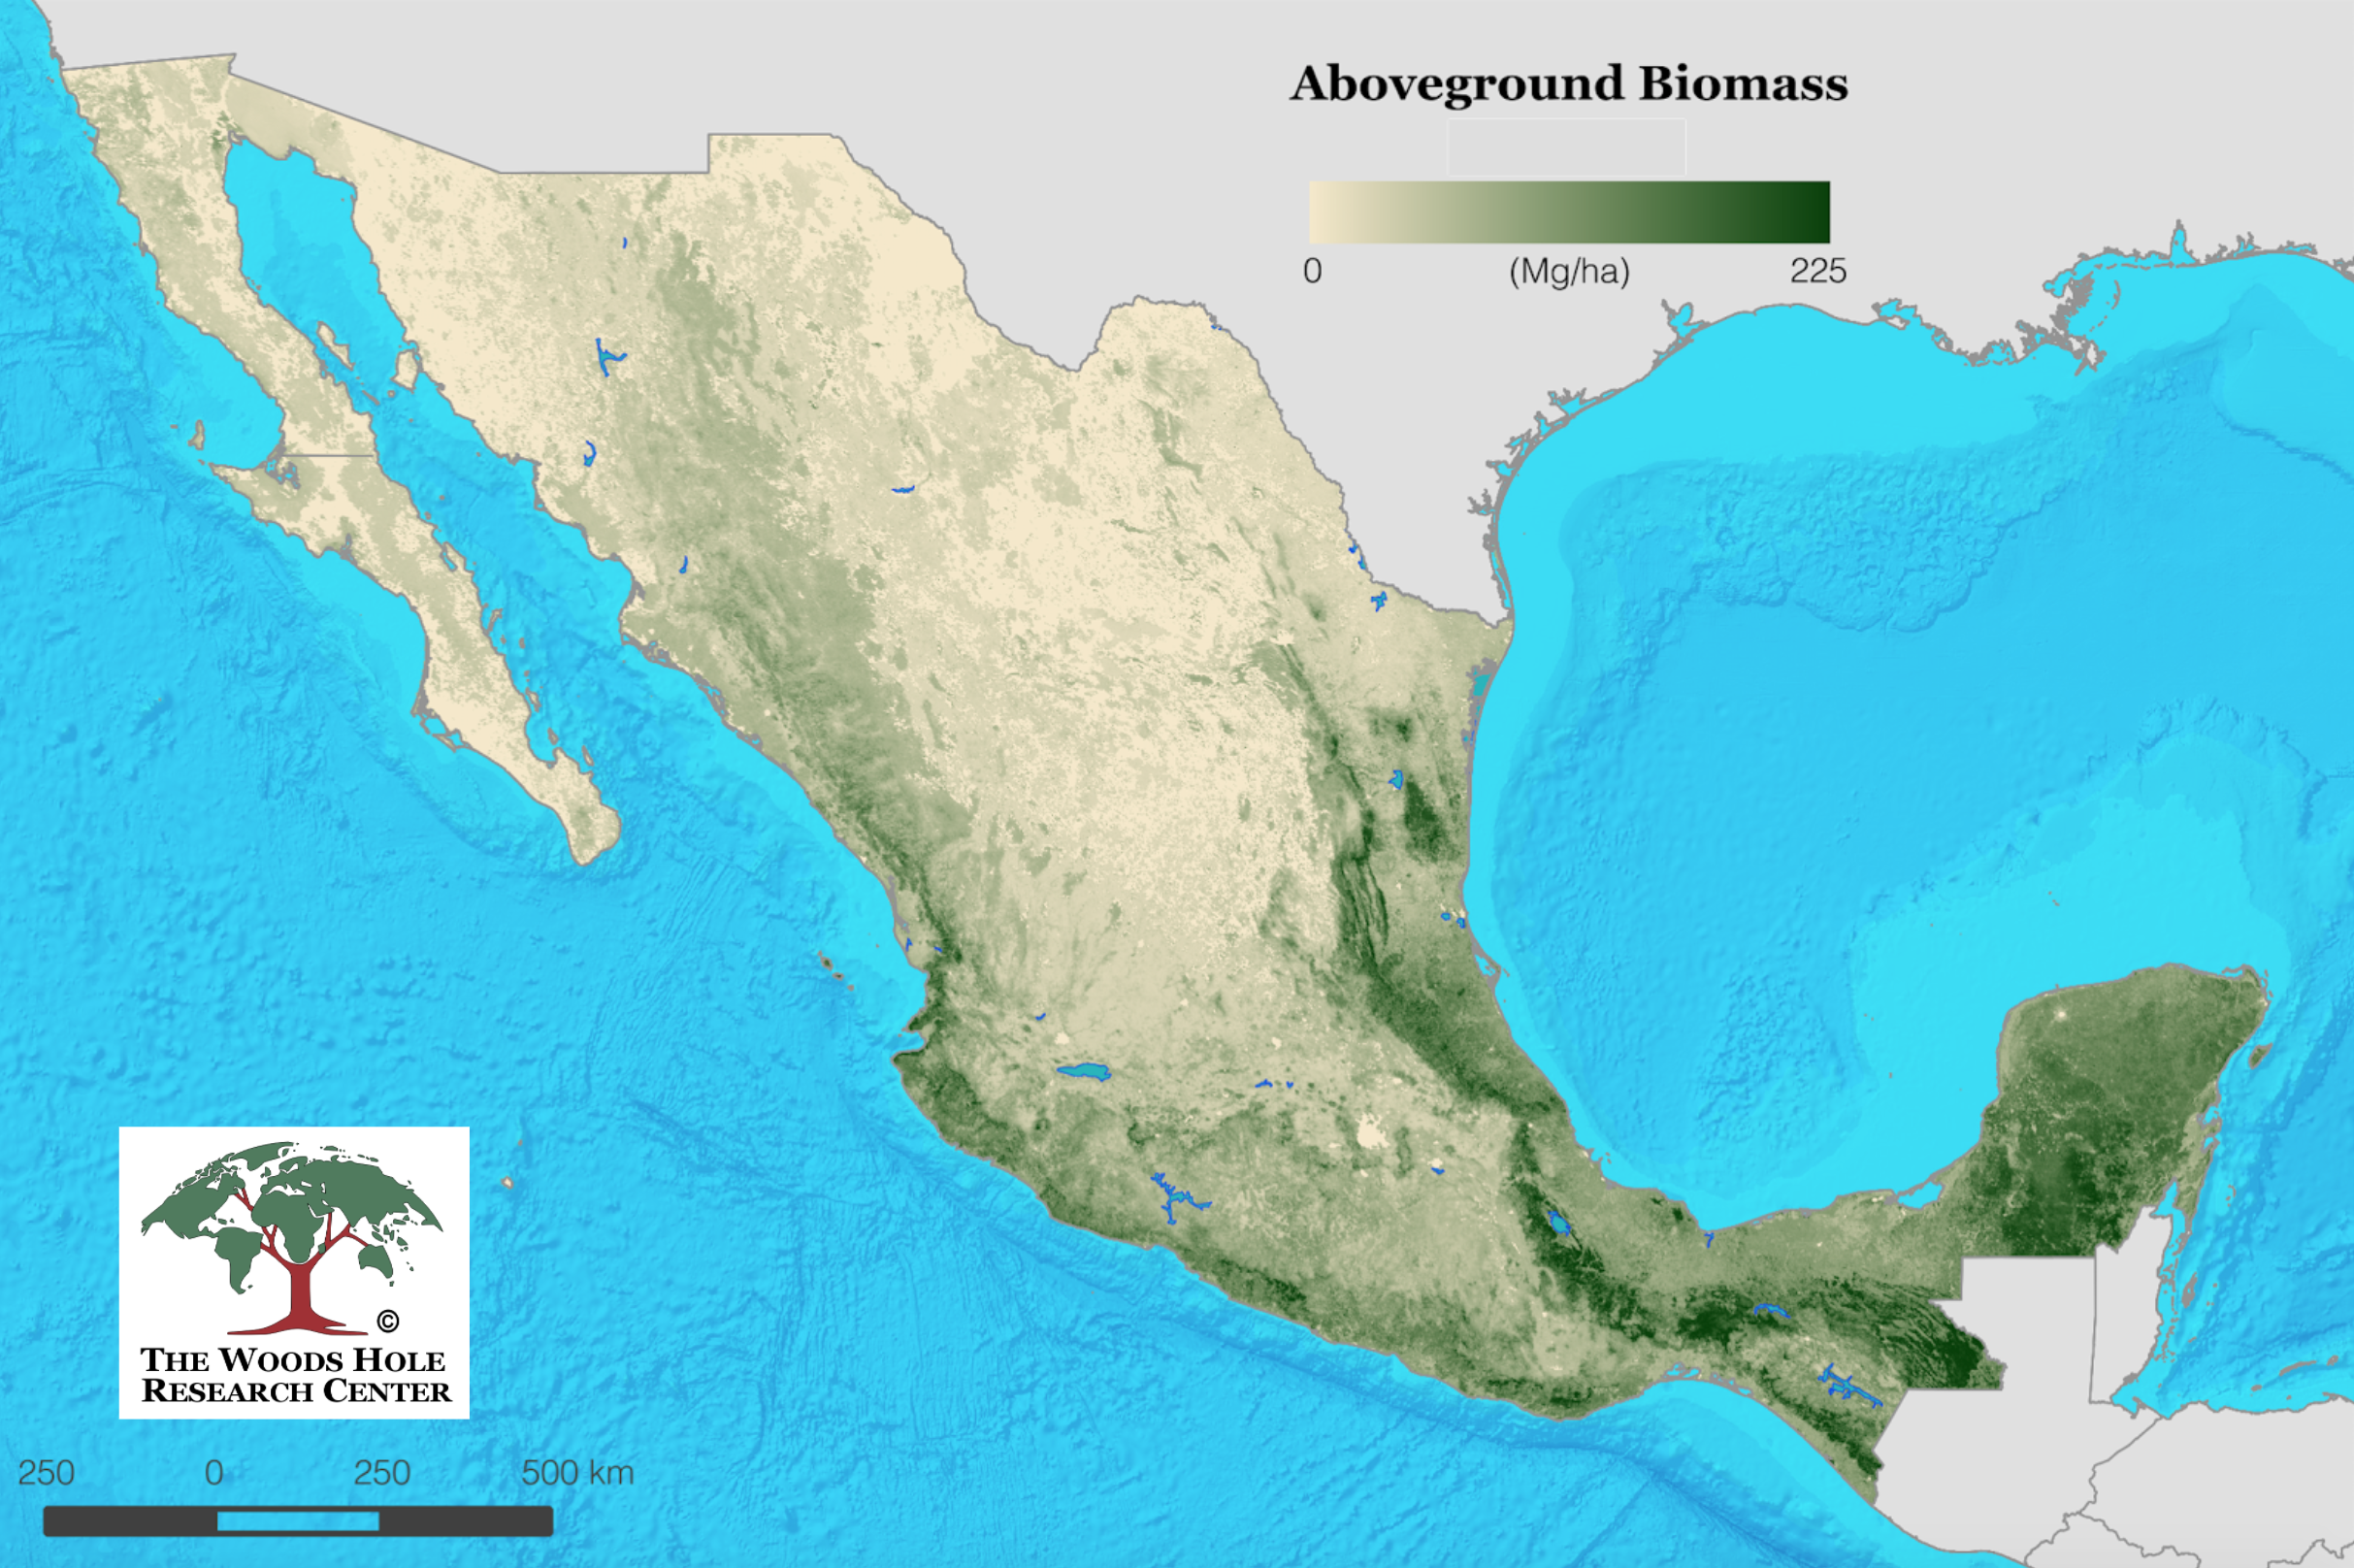
“Using R for Spatial Analysis, with an Example for Mapping Forest Biomass”, presented by Tina Cormier.(Tellus Labs) Thursday, October 19th, 2017. 12:00-1:30pm. Room S354, CGIS South building, 1730 Cambridge St., Cambridge, MA.


World Historical Gazetteer Project

The inaugural advisory committee meeting of the World Historical Gazetteer Project was held at the University of Pittsburgh, Sep 8th-9th, 2017. Funded by the National Science Foundation, the WHG will provide a core gazetteer and Linked Open Data framework for combining placename indexes for all regions and periods of human history. Read more in the Meeting Notes.


HARVARD GIS COMMUNITY NEWS

Map of the Month

Winner for September 2017 is the Baltimare GeoLoom co>map. This contest is sponsored by Harvard Kennedy School’s Ash Center for Democratic Governance and Innovation. Contest Info


CONFERENCES, CALLS & JOBS

Conference: State of the Map will be held in Boulder, CO. Oct 20-22. Read More


Job Opening: Harvard Chan School of Public Health has announced a position for Postdoctoral Data Scientist: GIS and mHealth to work on large scale environmental health and mobile health geospatial data. Read more

Job Opening: College of Holy Cross (Worcester, MA) invites applications for Visiting Part-time Faculty to teach one course Introduction to Geographic Information Systems. Read more

CFP: Call for presentations in the GIScience research sessions at ESRI User Conference 2018 to be held at the Esri International Users Conference, July 9-13, 2018, San Diego, California. Read more


The CGA Newsletter is published monthly. Editor of this issue: Lex Berman.


no links

no file attachments

Share

Political Geography GIS Workshop

Introduction to GIS lecture and lab for Gov. 2525 Political Geography Class.

Download the lecture slides.

Download the lab material.

no links

no file attachments

Share

PeriodO Project Update

PeriodO Advisory Committee Meeting Update (2017-09-25)

http://perio.do        meeting notes:  Lex Berman

The PeriodO project has developed methods for organizing, comparing, searching and – most importantly – referencing named historical periods as linked data.

Now in a second round of funding, the project is working on improving its search, reconciliation, and visualization services, and is reaching out to other projects and organizations in the spheres of digital humanities, libraries and spatio-temporal information retrieval to create a common framework for using the historical period definitions in all manner of queries and analytical processes.

Content Update

1. adding as a batch ingest, the Library Of Congress subject headings for named period to PeriodO, to achieve a Lowest Common Denominator approach, rather than a fine-grained integration of many specialized time periods from various sources. See progress: https://test.perio.do/#/p/Canonical/periodCollections/p06c6g3/

2. adding 18th and 19th Century entries to reveal how the concept of the periodization changed historically. Examples of these collections: http://n2t.net/ark:/99152/p05hrsf ; http://n2t.net/ark:/99152/p0jf288

3. adding periods from graphical sources, such as those found in Cartographies of Time, by Daniel Rosenberg. https://www.papress.com/html/product.details.dna?isbn=9781568987637

4. examine the way in which historical periods are represented in EpiDoc with the objective of being able to integrate period definitions to and from PeriodO. https://sourceforge.net/p/epidoc/wiki/Home/

5. reaching out to new potential collaborators, such as

Digitizing Early Farming Cultures (Austrian Centre for DH) https://defc.acdh.oeaw.ac.at/

Inscriptions of Israel & Palestine (Brown Univ) http://cds.library.brown.edu/projects/Inscriptions/

Technical Update

1. adding “derivedFrom” relations to the data model, using the Provenance Ontology https://www.w3.org/TR/prov-o/

2. adding Broader and Narrower terms from the SKOS vocabulary https://www.w3.org/2009/08/skos-reference/skos.html

3. adding “conflationOf” relations, which will enable users to pick their own subset of named periods and group them into a single entity, as in their own preferred representation of a period (by leaving out those they specifically do not want to include). No existing vocabulary was identified yet.

4. language tags are being switched from 3 character codes (including script definitions) back to 2 character codes. See: http://perio.do/technical-overview/#labels-and-documentation

5. discussed the use of Language references as URIs, such as http://www.lexvo.org/linkeddata/faq.html

6. refered to methods for the annotation of items with specific assertions and source citations. Recommended to investigate the use of http://nanopub.org/wordpress/?page_id=65 (possibly for other projects, rather than PeriodO).

7. the timeline (time range) histogram is being redesigned as a stand-alone D3 block with more functionality.

8. discussed the general methods for spatio-temporal concepts in the case of data reconciliation. Since OpenRefine lacks specific methods for spatio-temporal filtering, PeriodO has it’s own method: https://github.com/periodo/periodo-reconciler

Outreach and future collaboration

Interesting projects mentioned:

Monadic Exploration (of digitized topics) http://mariandoerk.de/monadicexploration/demo/#-1:00000

Workshop on Temporal Dynamics in Digital Libraries https://tddl2017.github.io/

Linked Infrastructure for Networked Cultural Scholarship (proposal phase) http://www.uoguelph.ca/~sbrown/#projects

WarSampo (Finnish WWII on the Semantic Web) http://seco.cs.aalto.fi/projects/sotasampo/en/

Social Networks and Archival Context Project  http://snaccooperative.org

overview : http://archive1.village.virginia.edu/spw4s/SNAC/

Data Liberate (Richard Wallis’ blog) http://dataliberate.com/blog/

Participants in the 2017-09-25 Meeting

Adam Rabinowitz https://liberalarts.utexas.edu/classics/faculty/atr253

Ryan Shaw https://sils.unc.edu/people/faculty/ryan-shaw

Patrick Golden http://ptgolden.org

Elton Barker http://www.open.ac.uk/people/eteb2

Tom Baker http://dublincore.org/about/executive/

Lex Berman https://www.iq.harvard.edu/people/lex-berman

Karl Grossner http://kgeographer.com/cv/

Antoine Isaac http://www.few.vu.nl/~aisaac/

Eric Kansa https://opencontext.org/about/people

Joseph Koivisto https://www.lib.umd.edu/directory/staff/jkoivist

Laura Mandell https://english.tamu.edu/dr-laura-mandell/

Dan Pett https://goo.gl/ztRWmH

Mia Ridge http://www.miaridge.com

no links

no file attachments
Share

Free GIS/Mapping Lunch & Learn

Join NEGIS (Northeast Geographic Information Society ) for Lunch & Learn with Caliper Corporation.

Student participants are invited to have a free lunch, free copy of Maptitude (US$695), and free attendance to the NEGIS presentation titled: Location Intelligence & Transportation GIS (GIS-T)

NEGIS provides sponsorships for students involved in mapping/GIS.

Agenda

DATE AND TIME

Thu, September 28, 2017
11:00 AM – 2:00 PM EDT

LOCATION

Caliper Corporation 
1172 Beacon Street, Suite 300
Newton Highlands, MA 02461-9926
Directions

If you would like to attend please email mtinfo@caliper.com .

Caliper Coprporation is providing free sponsorship to attend this event.

no links

no file attachments

Share

Using R for Spatial Analysis, with an Example for Mapping Forest Biomass

Download PDF SLIDES of the presentation

Speaker:  Tina Cormier,  Remote Sensing Scientist, Tellus Labs 

Location:  CGIS South S354   12pm to 1:30pm  

Watch the presentation on Youtube

In this presentation, Tina Cormier, will explore vector GIS, raster processing, lidar data, and cartography with R, an open source software environment and programming language that is well-positioned to have an impact in the rapidly emerging field of geospatial data science.

Widely used among academics, scientists, and data science practitioners, R is a flexible platform for both statistical computing and beautiful, fully customizable graphics.  A recent surge in the development of geospatial packages has enabled R to become a fully functional command line GIS as well.

Taking a case study on forest biomass mapping, Cormier will demonstrate the utility of R methods across the full range of the research process.

Learn R for Spatial with Tina’s FOSS4G Workshop

;

no links

no file attachments

Share

An approach to automate block cartogram creation

by Jeff Blossom

Presented at the North American Cartographic Information Society annual meeting.

October 21, 2017, Colorado Springs.

Cartograms that show a statistic in the form of equal sized blocks allow the map reader to quickly compare quantities across an area. However, at the time of this project, there existed no tool or algorithm that automatically converts a GIS shapefile into a block cartogram.  This talk will detail an approach that produced a block cartogram for a Texas County shapefile using data manipulation in Excel and the Cartography Toolbox in ArcMap.


Links:
View the slides

Files:
2017-09-22_1453.png

Share

Spatial Distribution of Businesses Offering UV Tanning Across 7 U.S. Metro Areas

Presentation at the 38th Annual Meeting & Scientific Sessions of the Society of Behavioral Medicine

San Diego, CA

March 30, 2017

Introduction: Societal appearance ideals drive consumer demand for UV indoor tanning, which now generates approximately $3 billion in revenue annually in the US. The rapid growth and infiltration of UV tanning into other industries (e.g., gyms) has been followed by a corresponding rise in melanoma. While proximity to businesses offering UV tanning is likely an important predictor of use by consumers, little is known about their geographic distribution. Methods: In fall 2014 and 2015, we gathered phone survey data on whether businesses offered UV tanning from 21,387 businesses in 7 major U.S. metro areas (Boston, NYC, Chicago, Seattle, LA, Dallas, Miami). We then linked business survey data to block group characteristics (sociodemographics, land use, presence of businesses of all categories) to build multivariable logistic regression models to predict probability of businesses offering UV tanning. We generated predictive maps of the spatial distribution of these businesses. Results: UV indoor tanning services were reported in the highest prevalence by tanning salons (90.2%), health clubs (17.3%), gyms (10.8%), and laser-treatment and tattoo-removal businesses (both 8.0%). The probability of UV tanning services in a block group was positively associated with percent of population of white race/ethnicity (p<0.01) and higher density of businesses (p<0.05) and negatively associated with percent of population with college degree (p<0.05). Sunbelt metro areas (Miami, Dallas, LA) had lower prevalence of businesses offering UV tanning compared to northern areas (p<0.01 for all 3 metros). Discussion: We observed important variability in spatial distribution of UV tanning. Presence of these noxious services may both normalize UV tanning as a societally valued behavior and increase use by nearby residents. Societal idealization of tanned skin, particularly in populations of white race/ethnicity with lower education in northern cities, fuels demand for UV indoor tanning, putting consumers at elevated risk for melanoma.

Links:
Link to the slides

Files:
2017-09-22_1504.png

Share