The 30th Annual PGSG Preconference to the 2017 AAG Annual Meeting

The AAG Political Geography Specialty Group is pleased to announce that the 30th Annual Preconference will be held at Harvard University on Tuesday, April 4, 2017, hosted and supported by the Center for Geographic Analysis, the Institute for Quantitative Social Science, and the Department of Government.

Date: Tuesday, April 4, 2017 [Please note that the AAG main conference begins on a Wednesday this year]

Time: Sessions will run from approximately 8 am – 5 pm

Location: CGIS South Building, 1730 Cambridge Street, Cambridge, MA 02138 [see here]

Paper presenters: Paper titles and abstracts of 250 words or less are due February 1, 2017. Please submit them with PAPER ABSTRACT SUBMISSION in the subject line to: aag.pgsg@gmail.com

Poster presenters: For the first time, PGSG is welcoming poster proposals. Preconference participants may only present in one medium (paper or poster, but not both). Poster titles and abstracts of 250 words or less are due February 1, 2017. Please submit them with POSTER ABSTRACT SUBMISSION in the subject line to: aag.pgsg@gmail.com

Registration: As with our past pre-conferences, there will be a nominal $20 registration fee for faculty only. Faculty, please bring cash or checks on the day of the event.

Evening events: In addition to the annual group dinner after the preconference, PGSG will coordinate a social hour on Monday night for early arrivals. More details to follow.

Lodging & transportation: The Harvard campus is easily accessible from the AAG venues in Boston via the MBTA’s Red Line. We suggest preconference attendees choose the same lodging they would for the main conference, but for those who would like more information about housing in the Cambridge area, click here.

AAG scheduling: Should you have any concerns about the scheduling of your main conference presentation, coordinate with your session organizers and AAG administrators.

PSGG organizers: Natalie Koch (nkoch@maxwell.syr.edu), Kenneth Madsen (madsen.34@osu.edu)

Inquiries: Please do not contact local hosts. All inquiries should be directed to the PGSG organizers individually or at: aag.pgsg@gmail.com

Updates will be posted regularly on the PGSG website at: http://www.politicalgeography.org/pre-conference/

no links

no file attachments
Share

Seminar on Linked Places and Modeling Historical Movement

a special event sponsored by the Center for Geographic Analysis

Presenters:

Karl Grossner  
Principal Investigator, Linked Places: Modeling Historical Movement
PhD Geography, UC Santa Barbara

Rainer Simon   – download:  PDF of Presentation
Senior Scientist at the Next-Generation Content Management Systems
AIT Austrian Inst of Technology

Lex Berman
Developer, Temporal Gazetteer  TGAZ
Web Services Manager, CGA

Date and Time:    Sep 20th, 2016    12:00pm - 1:15pm
Location: Room S153 (Asia Center), CGIS South Building, 1730 Cambridge Street


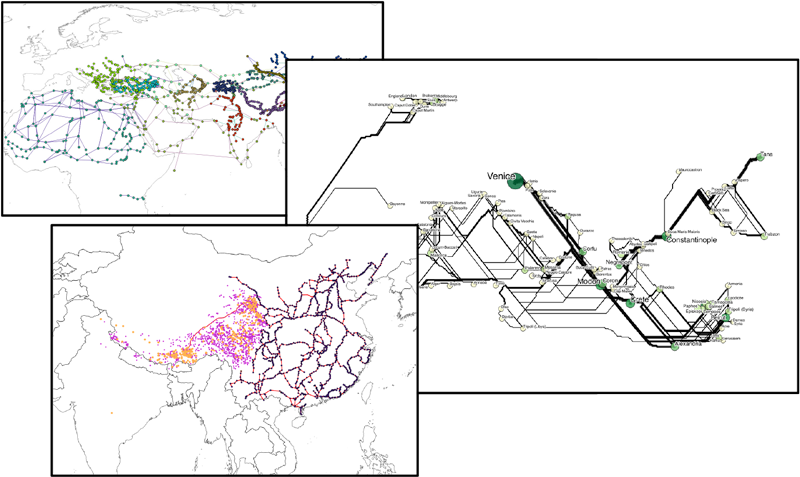
This seminar will present ongoing research to develop a conceptual model and practical schema for “historical movement.”   Building upon, and funded by a resource commons grant from Pelagios, (the Linked Open Data platform for historical places and historical collections), the Linked Places project seeks to define the fundemental entities and relationships for historical routes, journeys, itineraries, and flows of goods.

In practical terms, the Linked Places model will be able to capture information about specific journeys, the stopping points along the journey, and enable both mapping, linking references, and more detailed types of geospatial or semantic analysis.

This project springs from earlier work on ORBIS, a geospatial network of the Roman World, with the new objective of creating a simplified, generic, and open resource for describing and linking historical movements through time and space.

The seminar will include brief working statements about Pelagios, the Linked Places model, and the Temporal Gazetteer, and hopes to engage the audience in discussion on use cases and how such a model can be applied to historical research.

no links

no file attachments

Share

Seeking Space and Place in Holocaust Testimony

By Dr. Anne Kelly Knowles

Friday, October 7th, 11:30 - 1:00.  Robinson Hall (35 Quincy St. - Harvard Yard), Room 107. 

Audio Recording (.mp3  70MB)

Abstract: The Holocaust has become a new focus of spatial historical research in Europe and North America. The wealth of bureaucratic records and plans makes it relatively easy to map Nazi actions, camps and ghettos, and Nazi spatial visions for the Reich. It is much more difficult to map Holocaust spaces and places as victims experienced them. Survivor testimony provides rich information about spatial experience and movement, yet the information can be difficult to place in conventional cartographic terms for many reasons. The challenges multiply at scale. This paper presents the Holocaust Geographies Collaborative’s plan for grappling with the issues of mapping survivor testimonies and contextualizing them within the rapidly evolving universe of Nazi-controlled places and regional space. It will also discuss the crucial role that a multi-lingual regional gazetteer could play in facilitating representation of victims’ movements and bringing together victim and perpetrator perspectives.

Speaker Bio: Dr. Anne Kelly Knowles is a Professor of History at the University of Maine with interests in Historical GIS, Geovisualization, Digital Humanities, The Holocaust, Nineteenth-century United States, and Intersections of economy, technology, and culture and their expression in the landscape.  Dr. Knowles holds a PhD in Geography from the University of Wisconsin-Madison, and has held teaching positions at the University of Wales, Wellesley College, and Middlebury College, where she taught for thirteen years.  Dr. Knowles joined the Department of History at the University of Maine in August 2015.

no links

Files:
ch07_fig_03.png
ch07_fig_03crop.png

Share

Research Frontiers in Analysing Social Media Data

by Bernd Resch

Noon - 1:30 on Thursday 9/22.  Room S354, CGIS South Building, 1730 Cambridge St, Cambridge, MA.

View a recording of the presentation.

Abstract: The potential of social media as a valuable data source for a variety of application areas like urban planning, emergency management or public health has been widely acknowledged by numerous disciplines. Particularly the scientific field of GIScience has played a key role in producing useful results from social media data in the form of maps for decision support on various levels. While traditional and well-known geospatial analysis methods have been widely used, more sophisticated and holistic approaches are still widely lacking. This talk presents the results of cutting-edge GIScience research on social media and other user-generated data. The method spectrum includes semi-supervised learning approaches, neural networks, and self-learning systems, amongst others. The talk will foster a discussion on the integration of these approaches into GIScience research.

Speaker bio:  Bernd Resch is an Assistant Professor at University of Salzburg’s Department of Geoinformatics - Z_GIS and a Visiting Fellow at Harvard University (USA).  Bernd Resch did his PhD in the area of “Live Geography” (real-time monitoring of environmental geo-processes) together with University of Salzburg and MIT.

Lunch will be served.

no links

Files:
urban-emotions_detail_acquisition_en.png
urban-emotions_cropped.png

Share

50 Technical Workshops from the Esri UC 2016

50 technical workshops from the Esri UC 2016 have been posted in this YouTube playlist

https://www.youtube.com/watch?v=8FFWVXKGd_Q&list=PLaPDDLTCmy4bn62KhEV6s6NcbIfOjkoYw

no links

no file attachments

Share

Creating and Visualizing Space Time Cube using ArcGIS Pro

by Devika Kakkar

For a recent project, we used Space Time Cube (STC) in ArcGIS Pro to analyze the distribution of air pollutants over space and time for a particular area. This blog documents the procedure as well as the capabilities and limitations of using STC in ArcGIS Pro.

The Dell PC used for the project is a 64-bit Windows 7 Professional SP1 operating system machine with i7-6700 CPU @ 3.40GHz × 2 and 64 GB of RAM. The graphic card on the machine is Intel® HD Graphics 350 with 1824 MB of total memory.

The dataset consists of a 32MB shapefile containing 26,560 observations measuring the values of various air pollutants for a specific region. The dataset spans an area of 206 kilometer east to west and 132 kilometer north to south collected over a period 30 days. Please note that the original data comes with elevation of observation points, however the STC tool cannot consider elevation variations. It uses the Z dimension to represent time, the “higher” the cube location, the later in the Time dimension the observations were made. The value of each cube is a statistical summary (mean in our case) of all observations made within the spatial resolution range, regardless of the actual elevation of the data points.

The step-by-step procedure to create and visualize a STC using ArcGIS Pro version 1.1 is available in the video below:

https://www.youtube.com/watch?v=SIf6zcJmMqw&feature=youtu.be&a

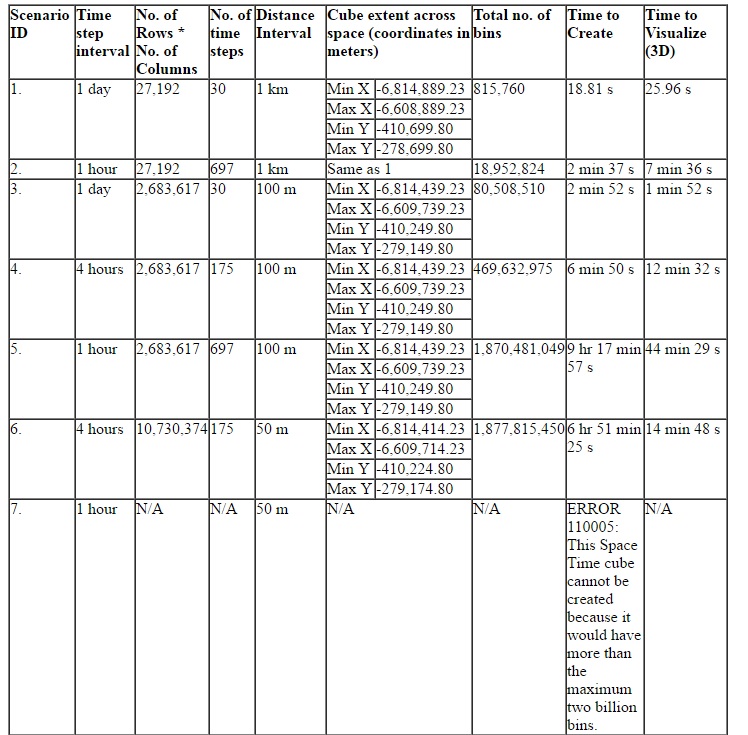
Different combinations of space and time scales were tested to find the crashing threshold in order to get a sense of the capacity of the ArcGIS Pro’s STC. The following table documents the characteristics as well as the creation and visualization time for each STC.

As it can be seen from the table above that STC with the resolution of 1hr/50m cannot be created because it would have close to four billion bins while the maximum limit is two billion bins only. The two billion limit comes from the record limit in a file geodatabase, please see the link below in order to learn more:

http://pro.arcgis.com/en/pro-app/help/data/geodatabases/manage-file-gdb/file-geodatabase-size-and-name-limits.htm

In addition, 26,560 observations spread across 4 billion bins would result in an extremely sparse cube. As you get more and more sparse, each feature will have fewer and fewer neighbors and this will affect the calculations for the statistic.

It was observed that during the creation of STC with resolution of 4hr/100m, the CPU usage for ArcGIS Pro was up to 13% while the memory usage was up to 31% whereas during visualization of the same cube the CPU usage was up to 13% and the memory usage was up to 20%.

From the above discussion, it could be seen that is important to find a proper resolution for the STC based on the following:

  • Objective of the project

  • Size of the dataset/ No. of observations

  • Spatial and Temporal extent of the dataset

  • PC configurations

Further, the following points should be kept in mind while working with STC in ArcGIS Pro:

  • Creation of STC requires projected data to accurately measure distances

  • The field containing the event timestamp must be of type Date

  • Before Visualization of the STC, one must set the elevation surface to zero

  • The time it takes to render the cube in three dimensions may vary considerably based on the number of features and the graphics card associated with your CPU

  • If some or all of your data is not drawing, it may fall outside of the Visibility Range limits, which can be cleared. If some or all of your data is underground, you may need to turn off Elevation Surfaces

STC is a very useful tool for analyzing data distributions and patterns in the context of both space and time. This blog can be used as a reference when working with STC, particularly in the case of large datasets.

no links

no file attachments

Share

GPS Data Collection - Spring 2017

This workshop will introduce the concept and various uses of the Global Positioning System (GPS). Students will use mapping GPS devices in the field, and upload the mapped data into desktop and internet mapping applications. Intended for students researchers who plan to use GPS for their field work. Note: This workshop includes time outside, so dress accordingly. Bring your own GPS unit, if you have one.

Download Workshop Materials

Note: This date may change due to weather and/or other circumstances.

no links

no file attachments

Share

ArcGIS Online & ArcGIS Maps for Office - Spring 2017

Learn about the easy new tools Esri has created that take advantage of all the powerful mapping capabilities. ArcGIS Online and Esri Maps for MS Office give you the power of GIS without the learning curve. Do drag-and-drop mapping, geocoding, routing and visualizations outside of ArcGIS Desktop. Create interactive web maps you can embed in your own blog, web page or PowerPoint slide. Learn about Esri’s ready-to-use content. Find data, create a web map, and share it - all in about five minutes.

Download Workshop Material

no links

no file attachments

Share

Open Source QGIS - Spring 2017 [New Date]

This workshop has rescheduled, the original date was Feb 24th

An introduction to Quantum GIS for beginners, this workshop will cover the basic methods for opening various data formats, dealing with projections, joining tabular data to vector GIS layers, symbolization, and exporting data. No previous knowledge of GIS or statistics is required.

no links

no file attachments

Share

Basic Introduction to GIS - Cambridge - Spring 2017

Brief introduction to GIS, and the CGA workshop training series, to help students determine workshops that are appropriate for their individual needs. Students will use online and desktop GIS software.

Download workshop material

no links

no file attachments

Share