Human migration has been an important activity in human societies since antiquity. Dramatic increase of its intensity is observed in the modern era. Understanding this phenomenon, its causes, processes and impacts often starts from measuring and visualizing its spatiotemporal patterns. This online platform is built for users to interactively visualize human migration through space and time. To view an administrative unit's profile, single-click anywhere inside the unit's border or select the unit from the drop-down menu. Toggle the Origin/Destination tab to set the selected unit as either the origin or the destination of migration. Hover the mouse over any stream to view migration count for the displayed year. Streams turn white when touched and are otherwise colored according to the absolute number of migrant stock, as indicated in the 'Legend' tab. To zoom, double-click the map or use the +/- controls in the top left corner. Click on the clock symbol on the top menu bar to bring up the time bar. Select year by clicking on the time bar, or hit the play button to automatically step through the years.
World
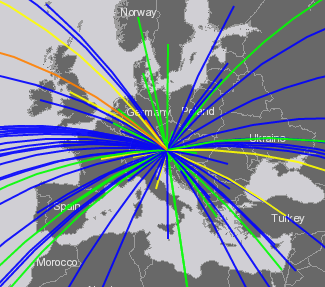
Part of the forth coming Crossroads of Migration research agenda, this map visualizes the movement of migrants from origin to destination countries. It is based on standardized 2013 United Nations data*, a compilation of demographic reports from 232 countries. Suggested Citation: Gest, Justin and Boucher, Anna 'Crossroads of Migration Stock Map', Harvard University Center for Geographic Analysis, accessed via www.crossroadsofmigration.com. *United Nations, Department of Economic and Social Affairs (2013). Trends in International Migrant Stock: Migrants by Destination and Origin (United Nations database, POP/DB/MIG/Stock/Rev.2013).
China
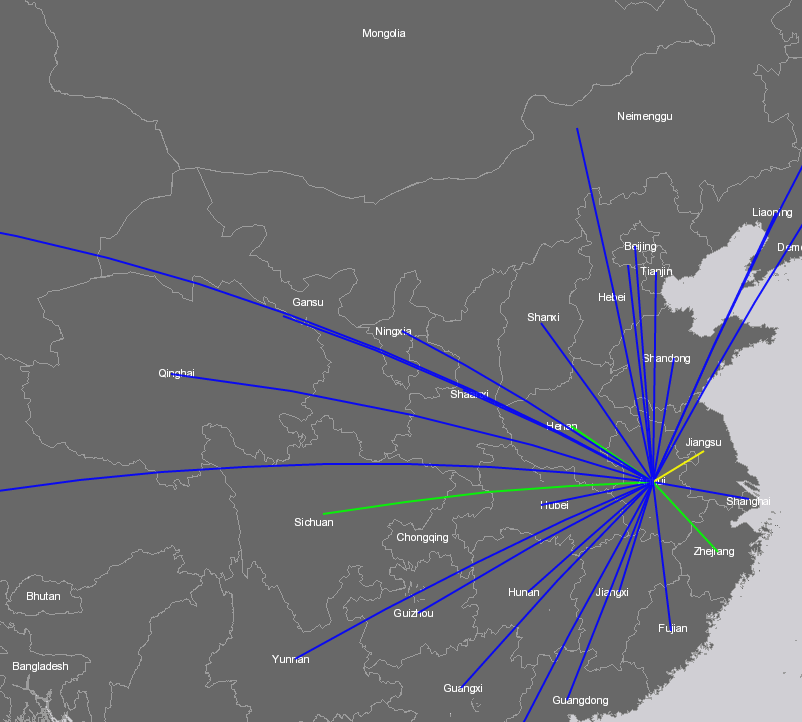
This map uses data summarized from the fifth (2000) and sixth (2010) China national population census data and the 0.95% sample data of the fifth China national population census data (2000) (Lao, under review). The provincial boundary data is based on the provincial polygon layers of the corresponding years, published by the China Data Center at the University of Michigan (2015).
United States
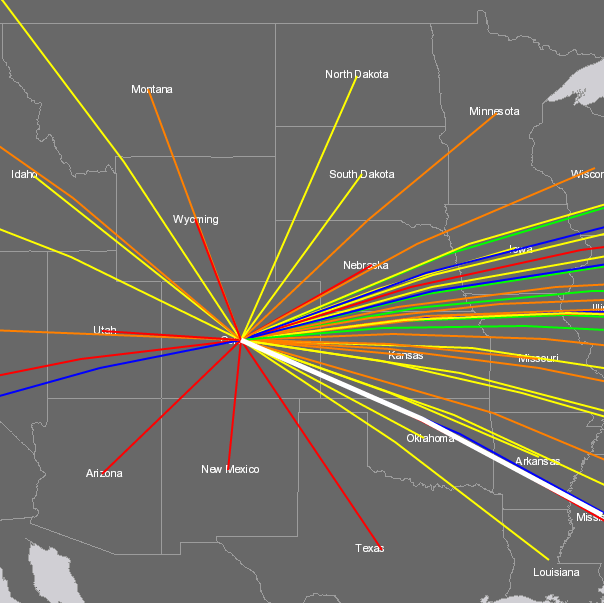
This map uses data published by the US Census Bureau in downloadable MS Excel format, called the State-to-State Migration Flows. Description of the data is available on the Census Bureau’s website (U.S. Department of Commerce 2015). The state and territories boundary data is based on the US States polygon layer in Esri licensed Data and Maps package of the corresponding years.